SAT Tips and Tricks
Graphing Calculator Hacks
You are currently viewing Page 1 / 2.
The SAT rewards students who understand the material well; however, when we do come across a tough question, we can use our
graphing calculators to squeeze out SAT points we would never have recieved. The SAT rewards time and effort. Over time, you will find your own tricks. They might be on the calculator or on the paper.
Let's take a look at a few SAT questions and pretend we have absolutely no idea how to algebraically solve it but we have some idea of the concepts.
Do we give up? Of course not! Like squeezing that extra bit at the end of your tube of toothpaste, pulling out your calculator and
punching in numbers like a madman may save you in the long-run.
If you're a high math scorer (770+), consider using these quick calculator tricks to sanity-check your answer.
Please note that this is a guide on how to think in terms of calculators, not how to cheat on these specific types of problems.
When in Doubt, Table it Out
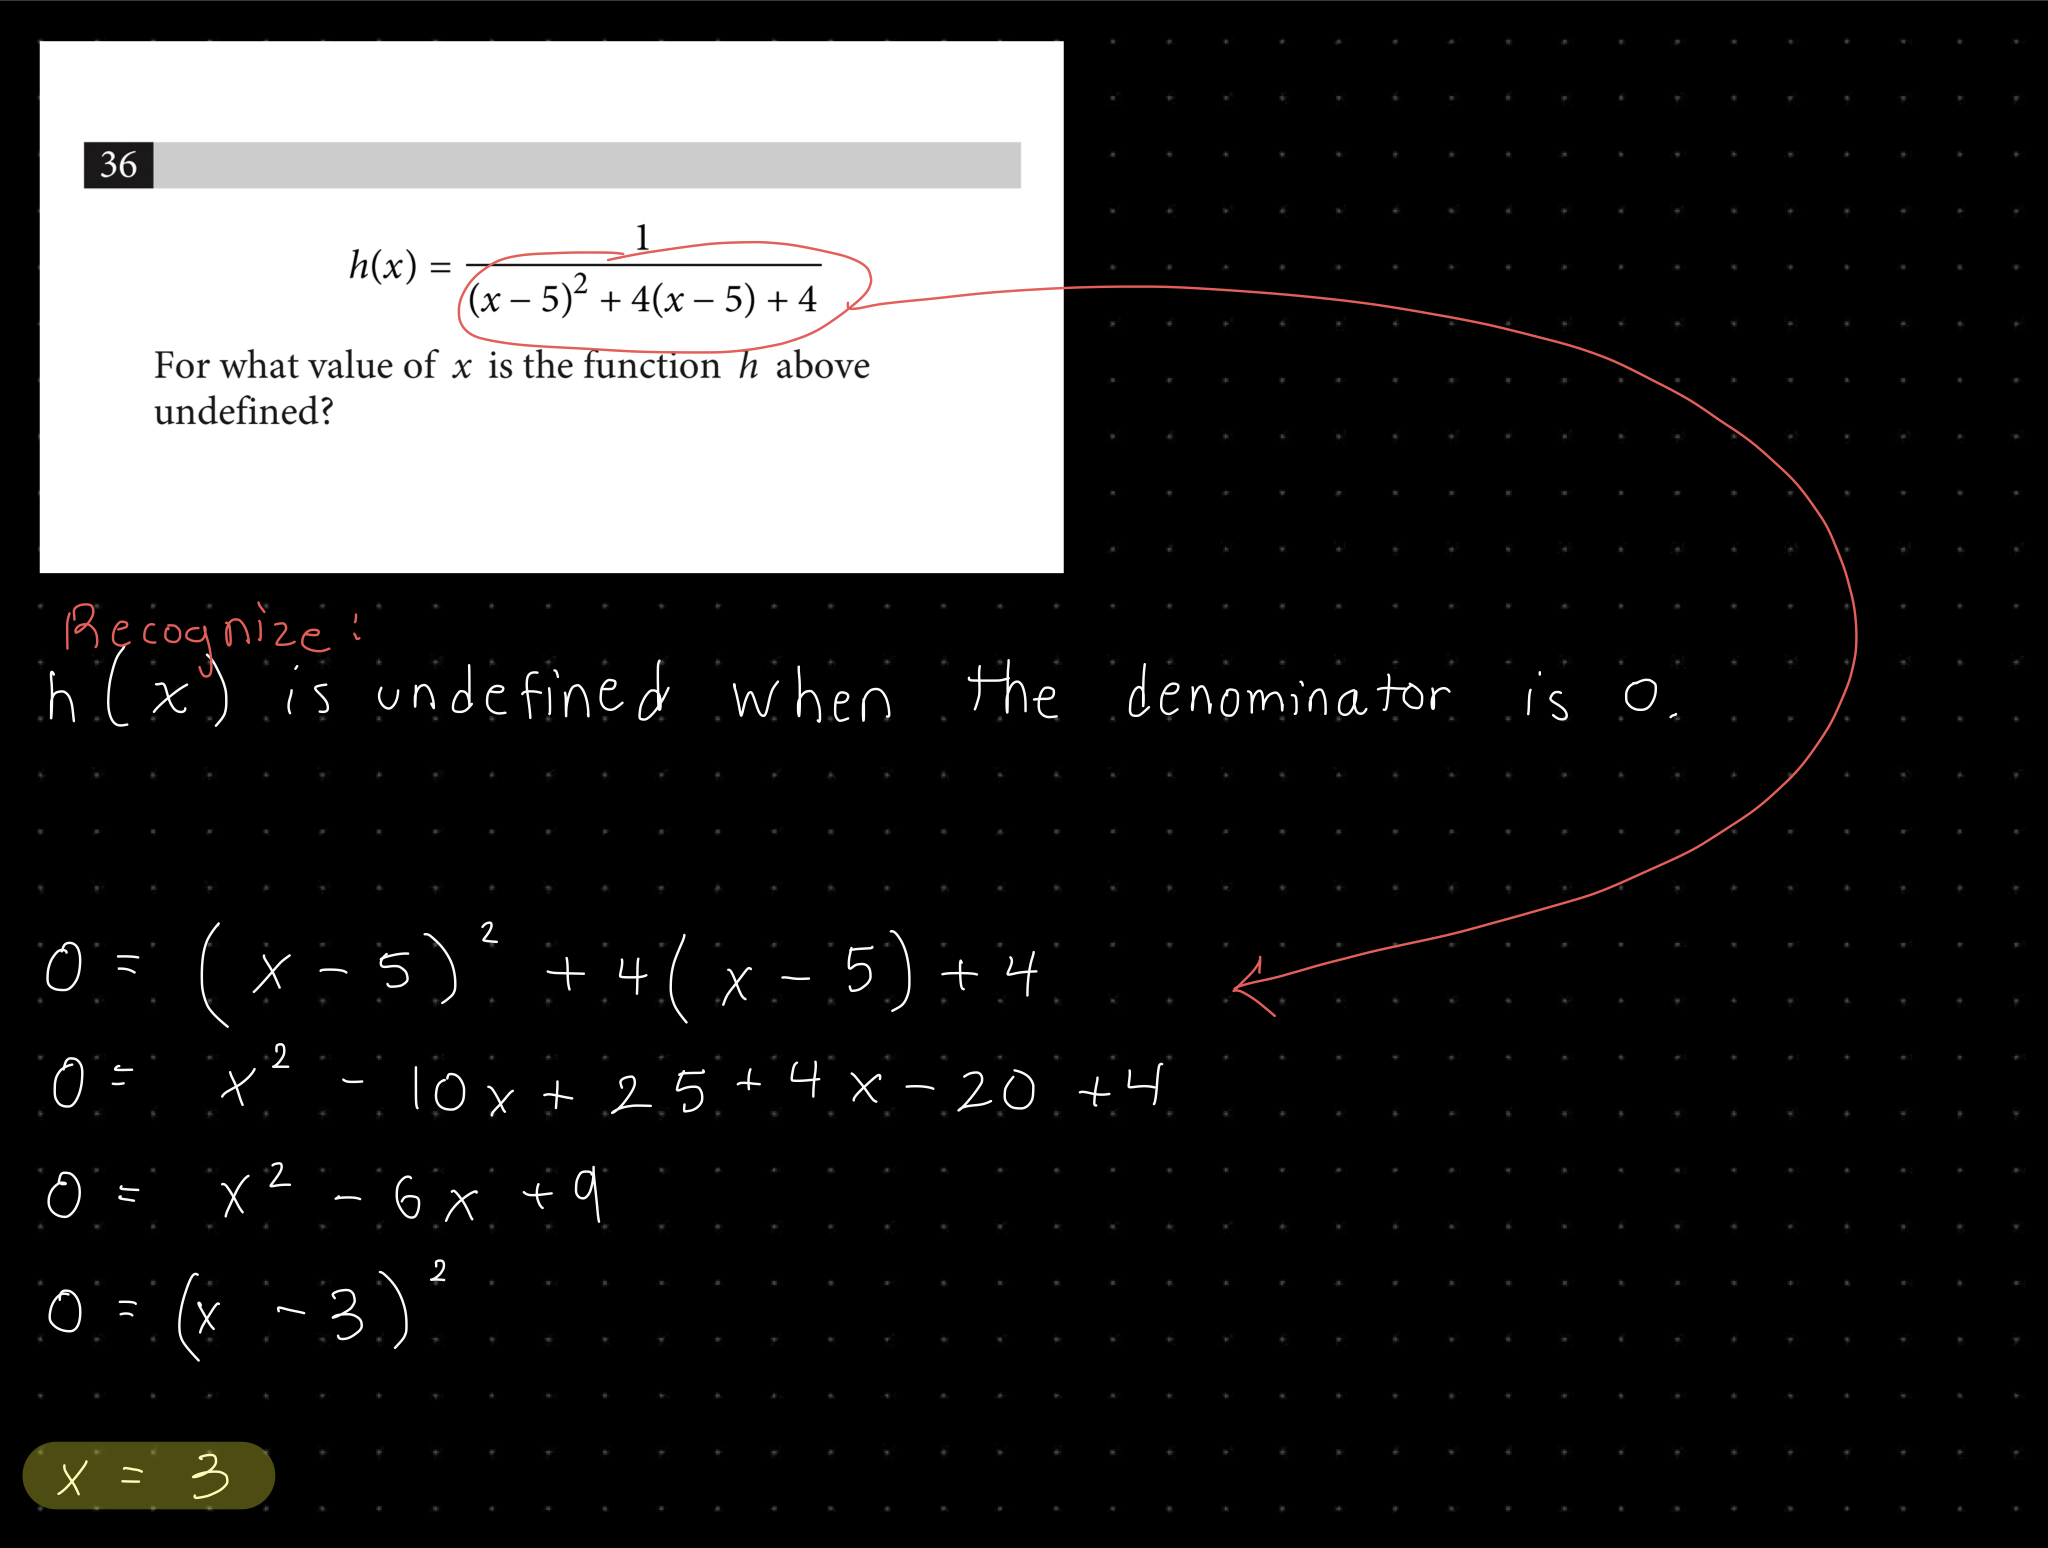
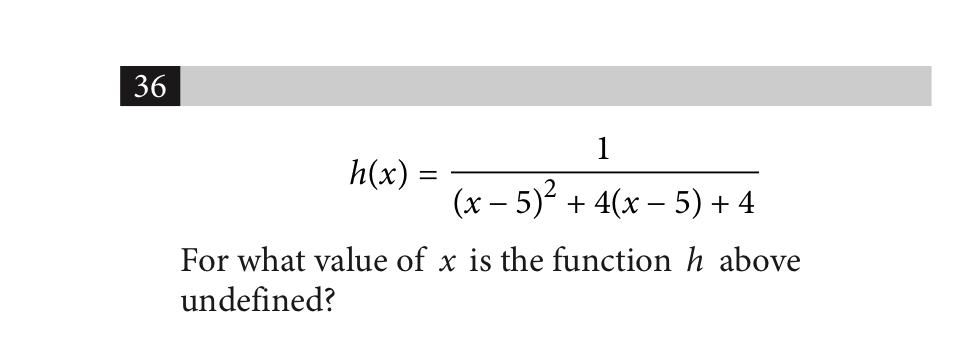
SAT Question 1.4.36
How to solve this without understanding this in 10 seconds.
Note: I used a Texas Instruments Ti-84 Plus CE graphing calculator. You may have different buttons and settings on your calculator.
-
Press the y= button at the top left of your calculator.
Down below, in image spoiler (1), I circled it in red for you. -
Plug in the equation.
On the Ti-84 Plus, press alpha + X,T,θ,n > (link) to get a fraction bar! -
Hit 2nd + graph > (table)
Down below, in image spoiler (2), I show my result. Look for the x-value that produces an undefined solution. (It should say "ERROR") -
Why does this work?
When x=3, the denominator of h(x) is undefined. The big takeaway here is the "table" button. Rather than plugging in random values of "x", simply table it out!
If you'd like, check out image spoiler (3) for how to do it for real. Use the table button to confirm your answer or replace it if you have no idea how to algebraically solve it.
Image Spoiler (1) [Graphing Calculator]
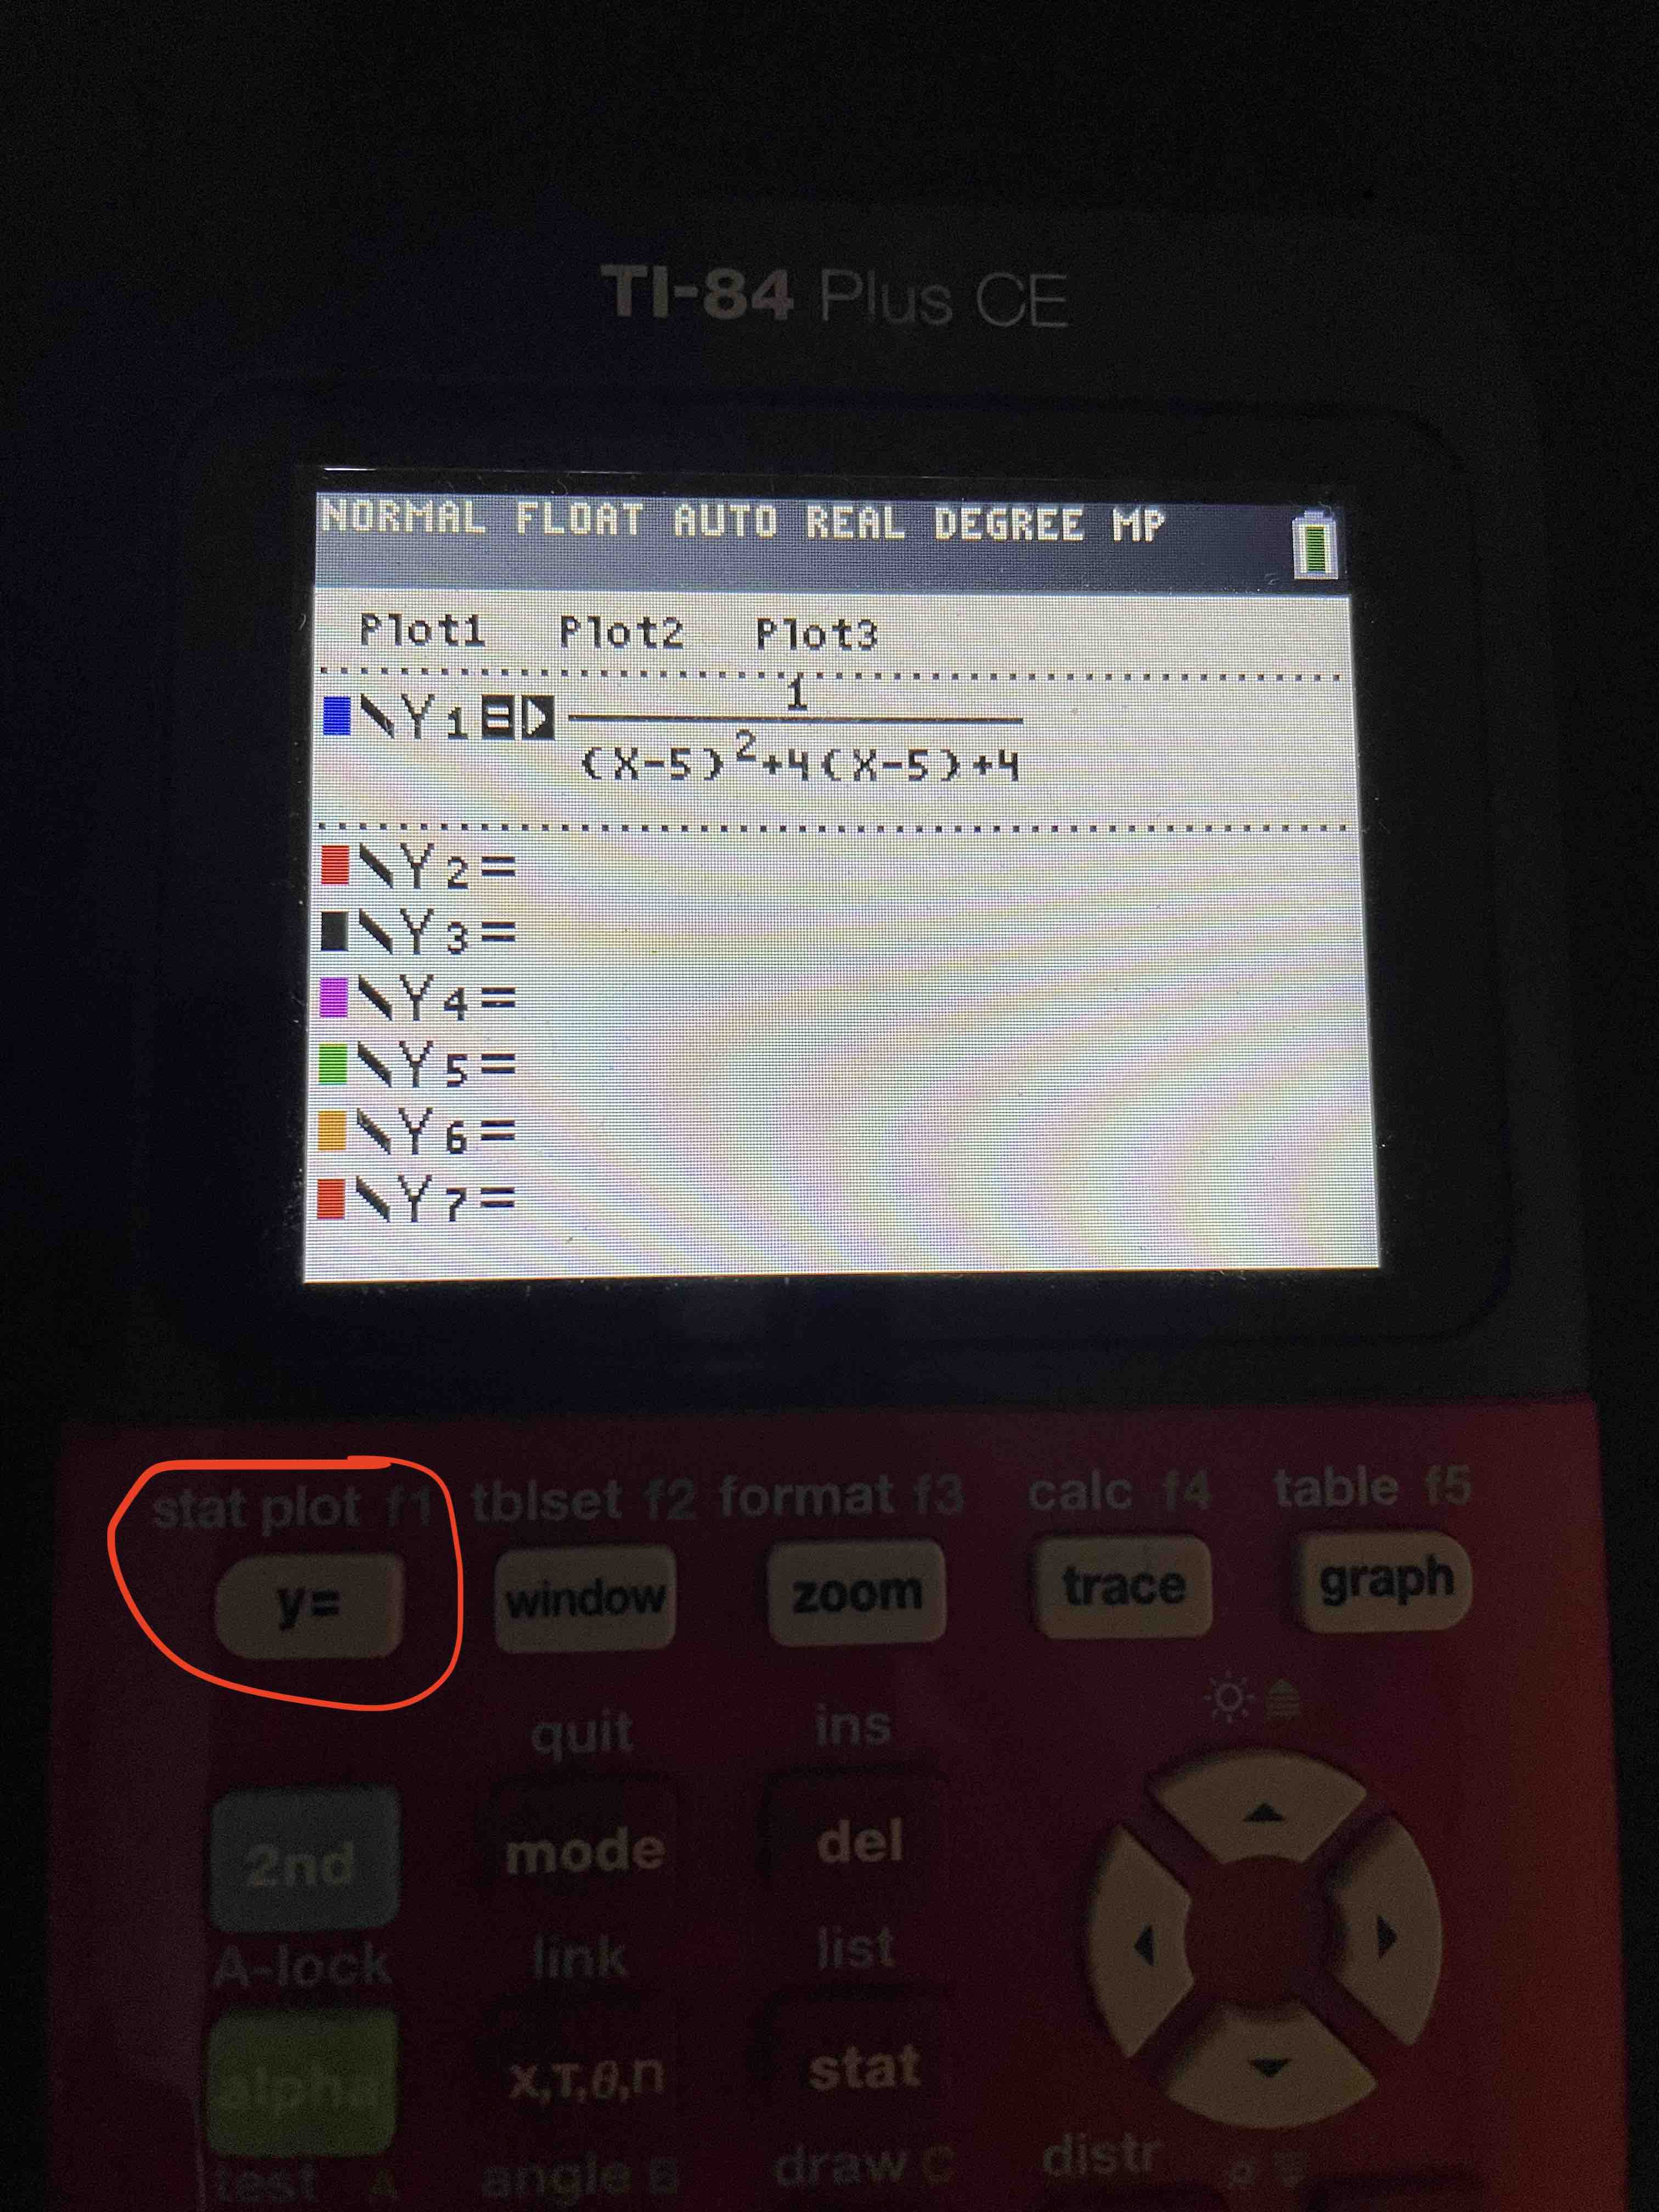
Image Spoiler (2) [Table Result]
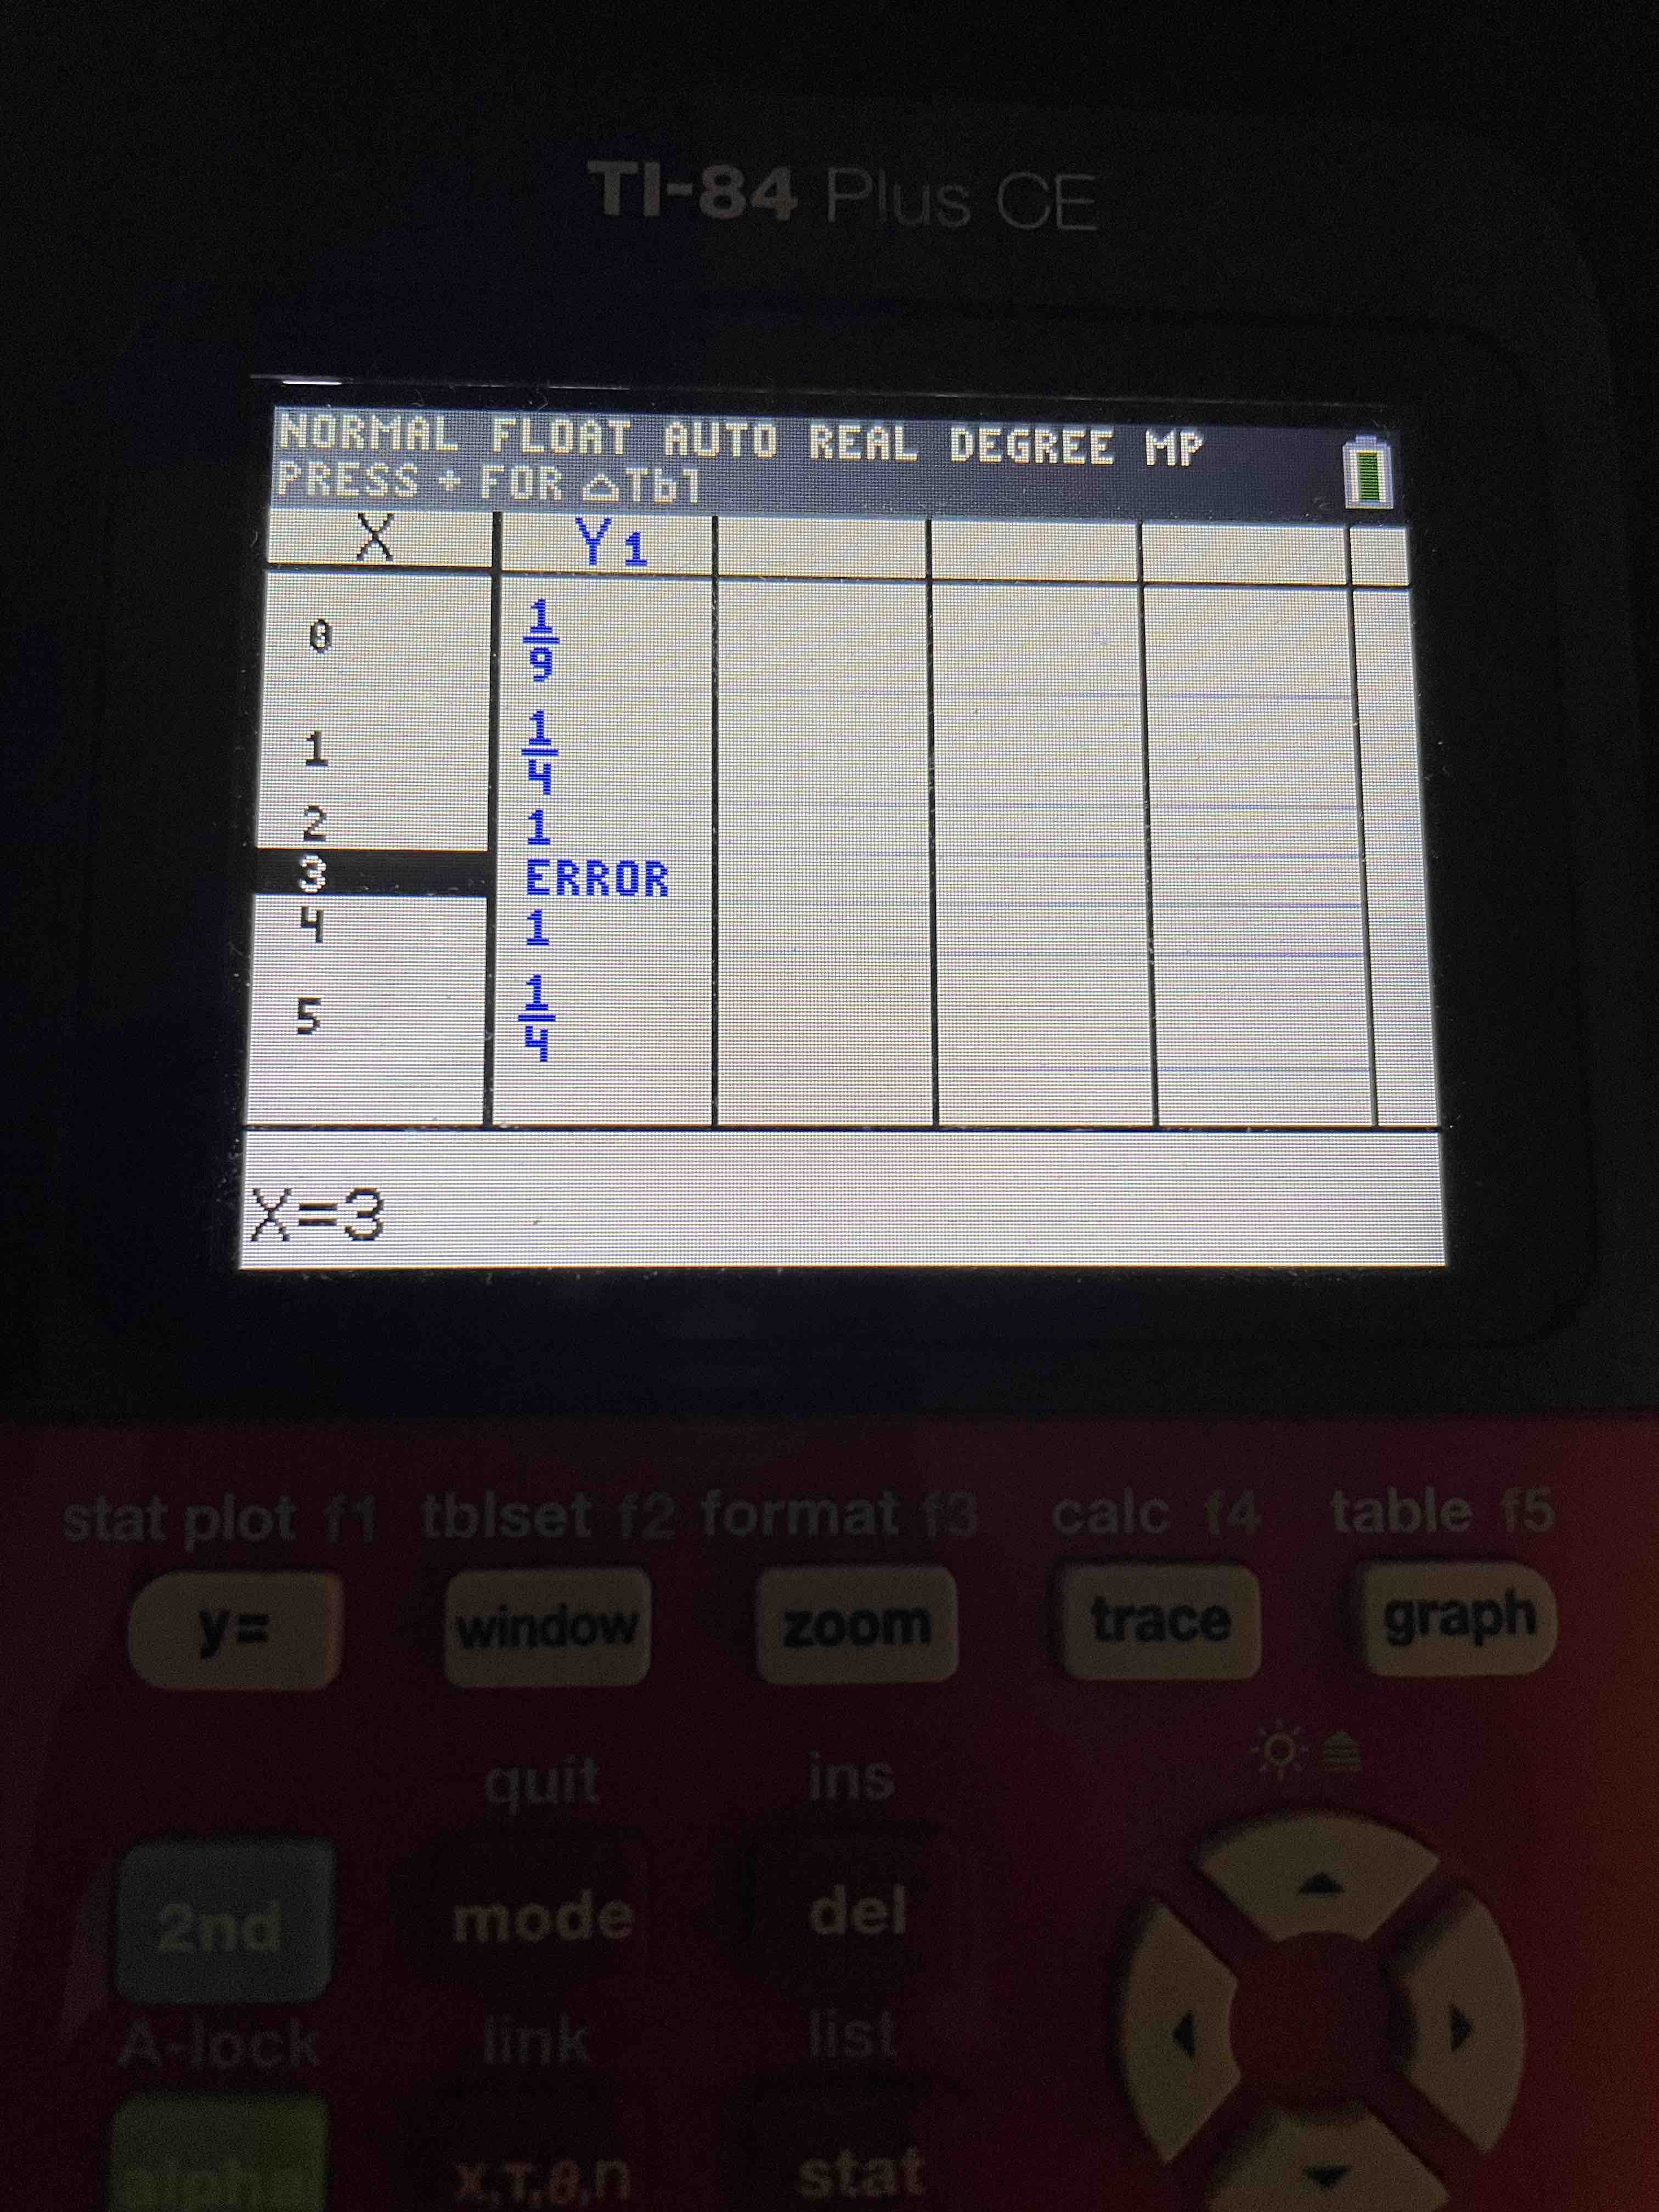
Image Spoiler (3) [How to actually do it]
Give me an example problem!
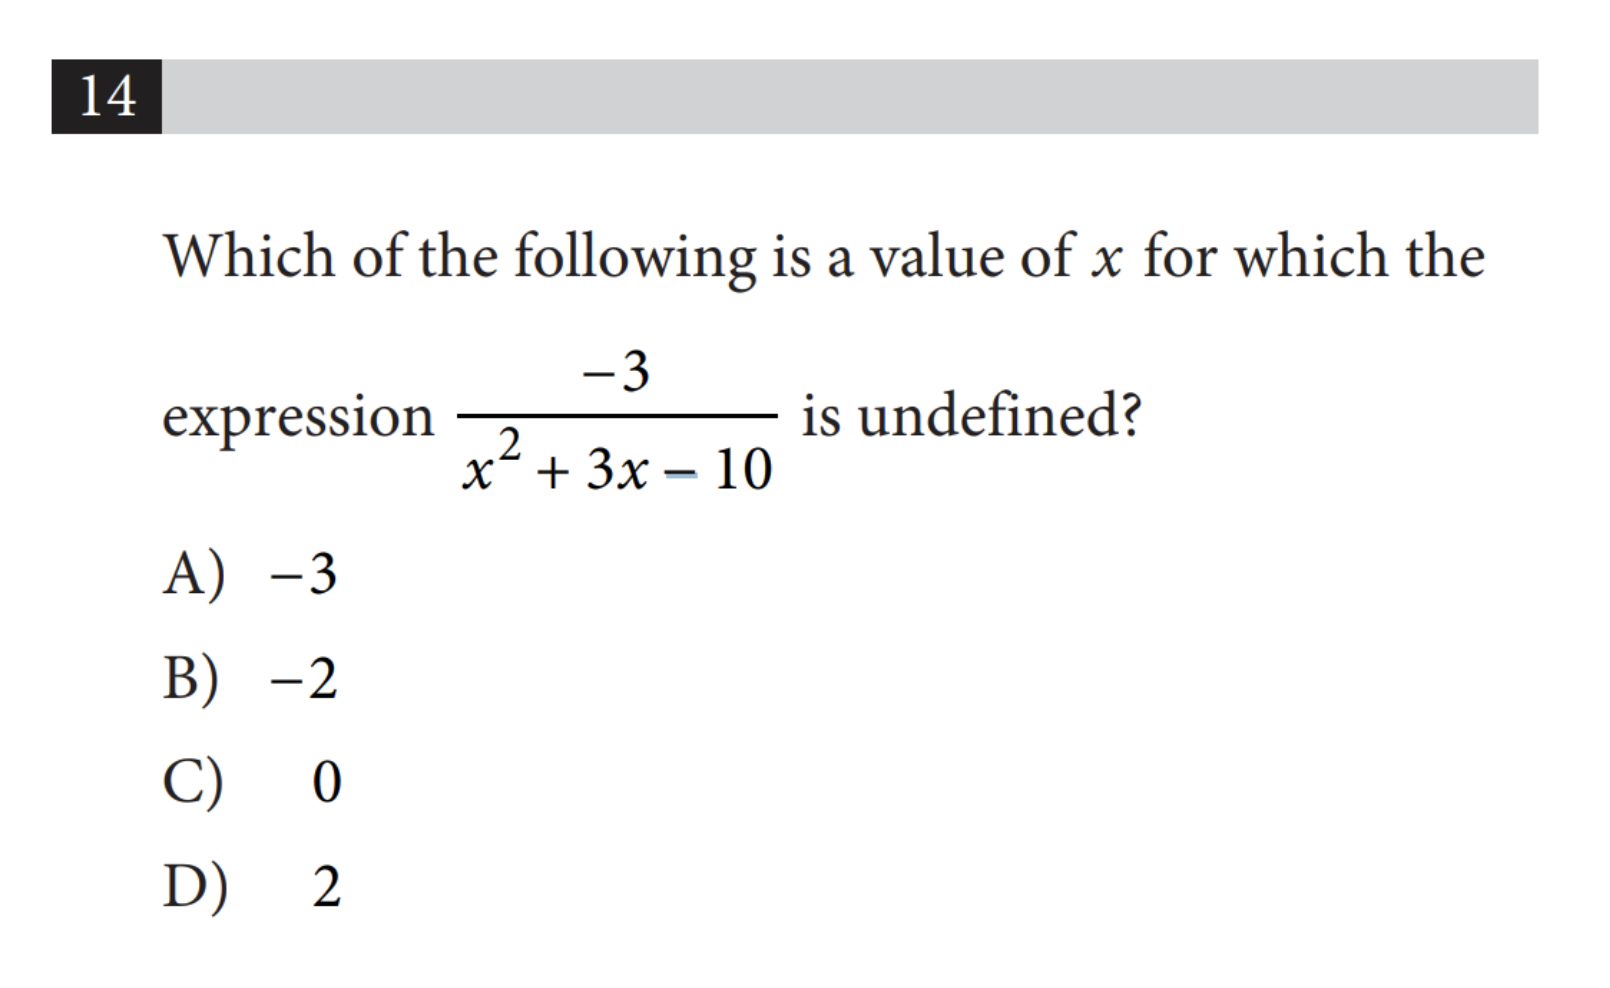
Answer to the example problem
The answer is letter (D)
What if I don't have a graphing calculator?
A graphing calculator is a very powerful "last ditch" tool on the SAT.
Graphing calculators are STUPIDLY expensive.
I suggest you check around if you could borrow one from your Math class, schoolmates, or school.
The Graphing Calculator Graphs!
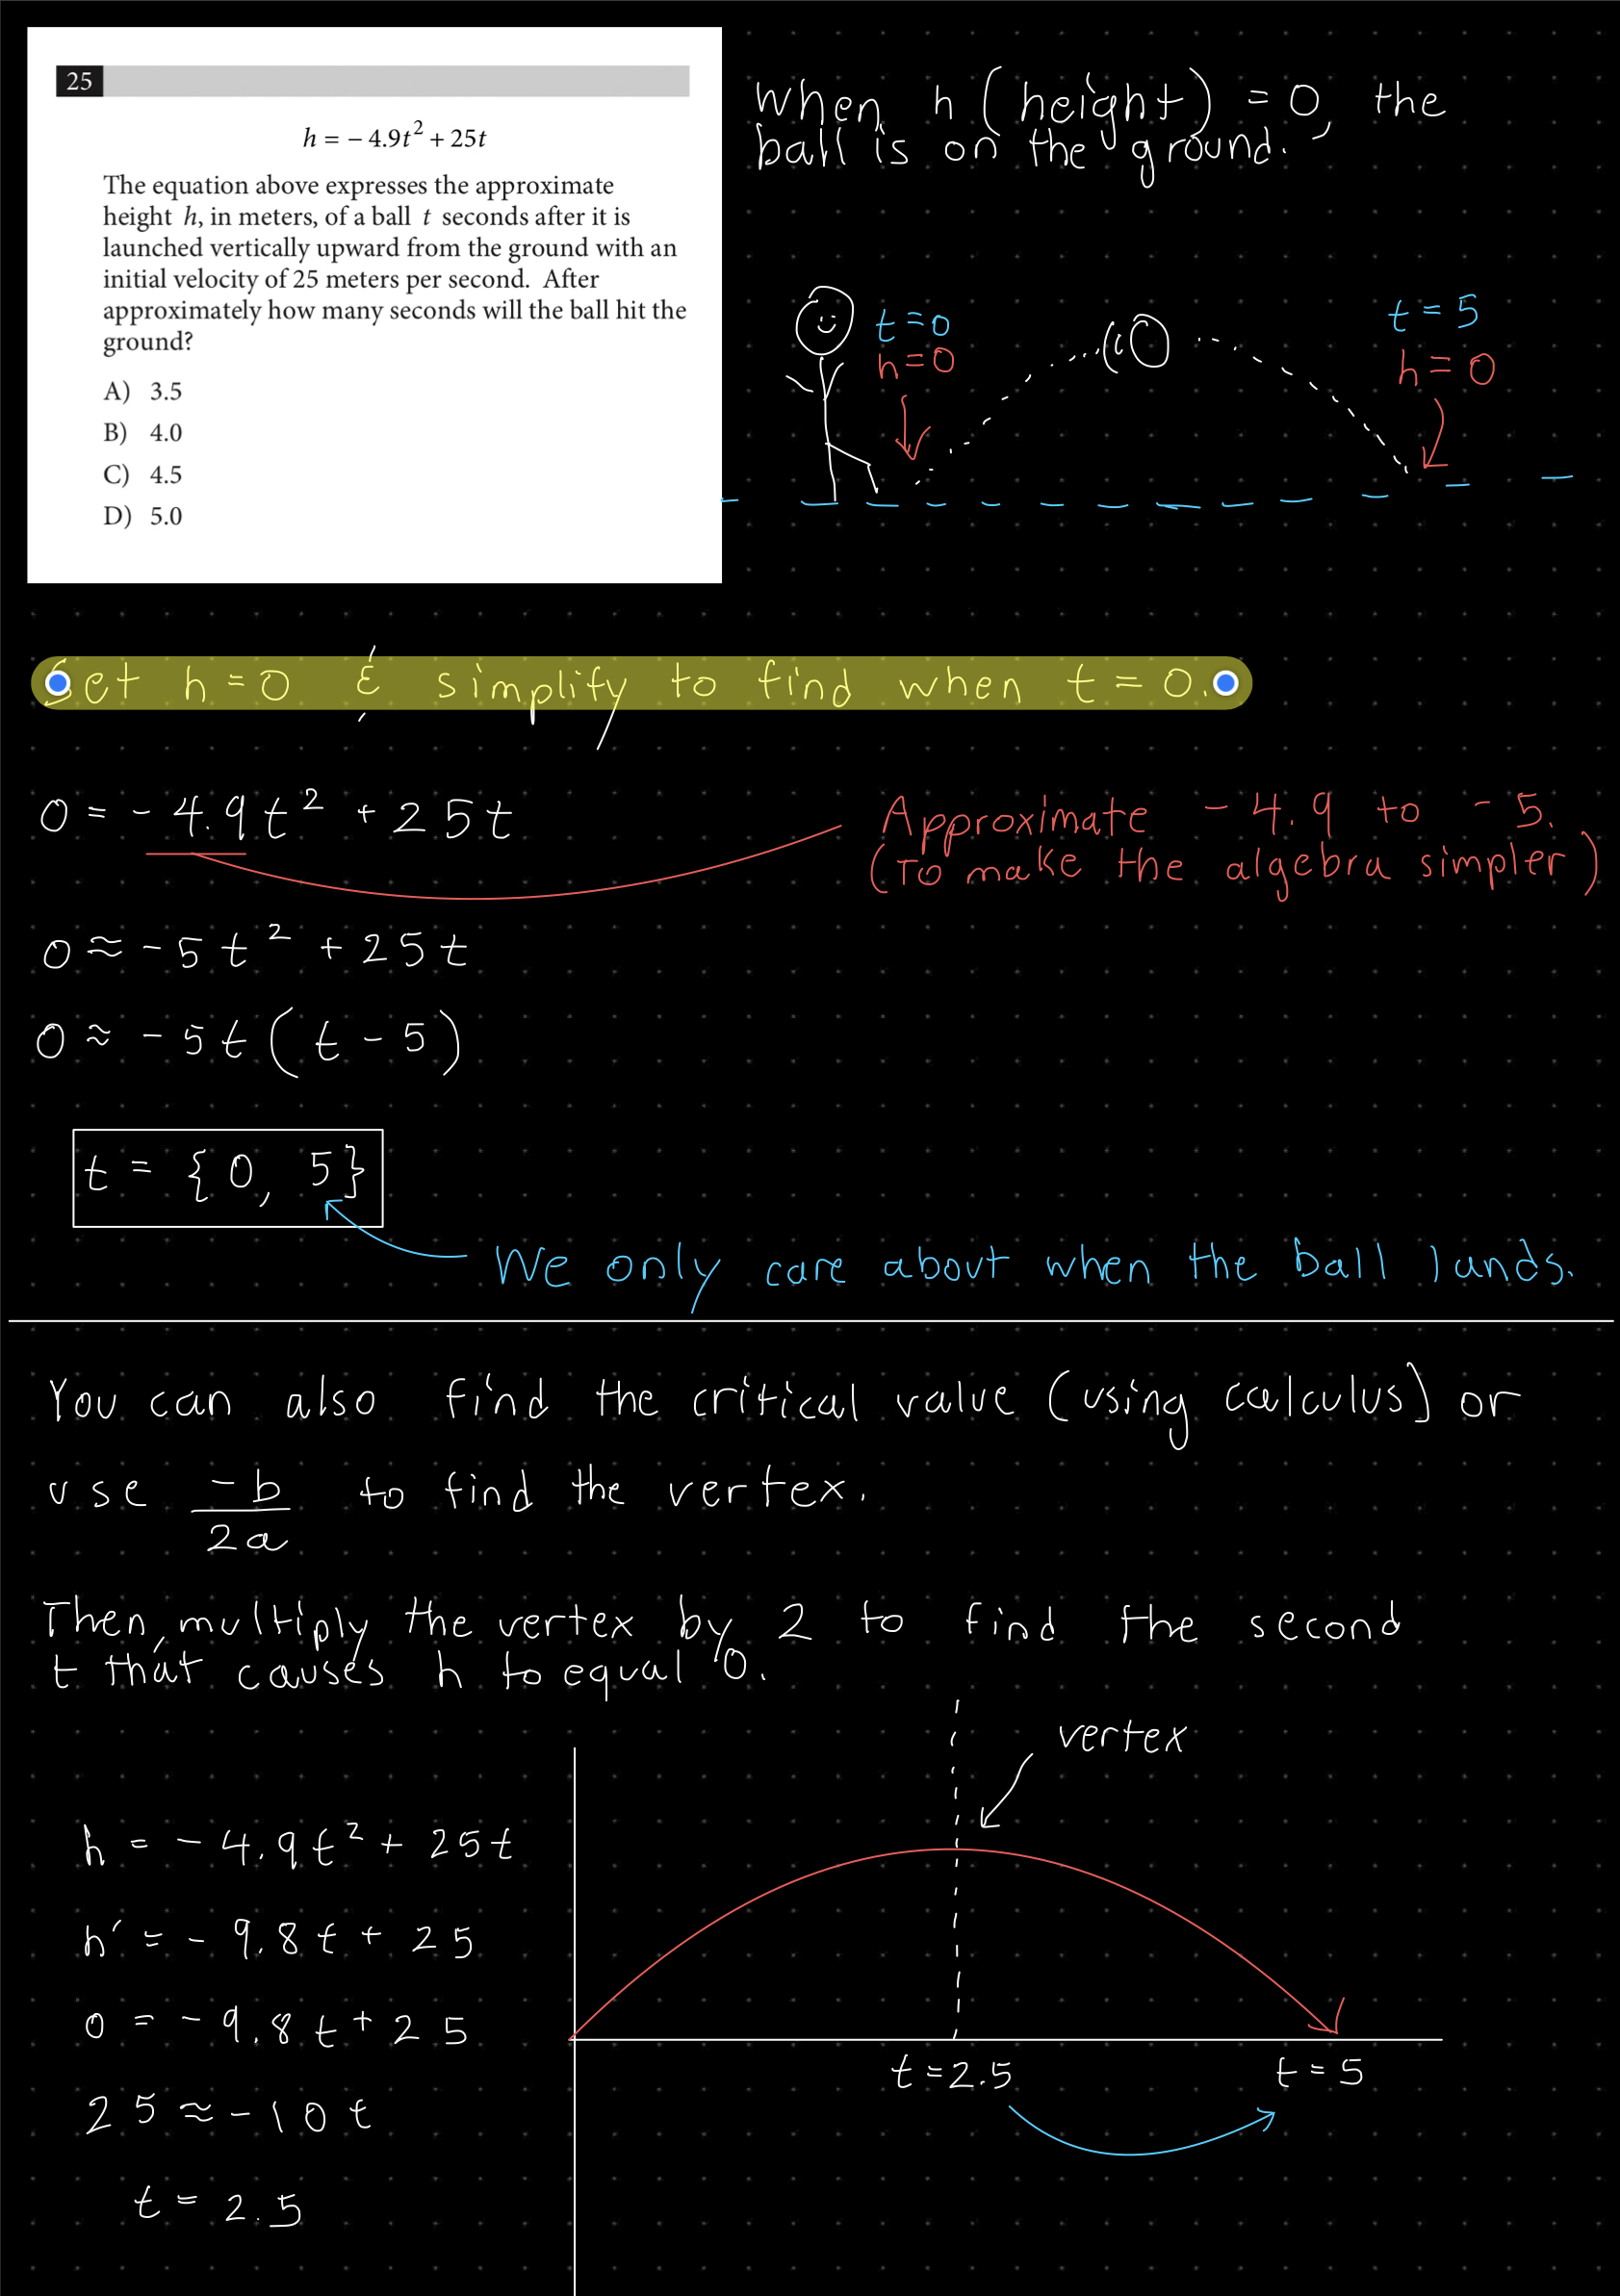
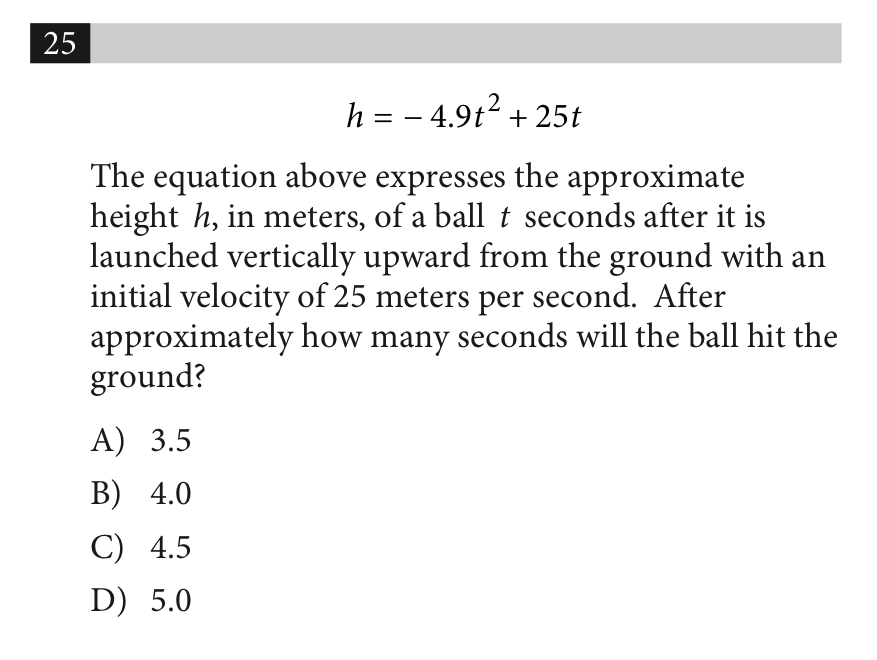
SAT Question 1.4.25
How to get a different perspective.
Note: I used a Texas Instruments Ti-84 Plus CE graphing calculator. You may have different buttons and settings on your calculator.
-
Press the y= button at the top left of your calculator.
Down below, in image spoiler (1), I pointed at it with my pencil. -
Plug in the equation.
Be sure to use button shortcuts such as x2 to reduce the time lost fiddling with your calculator. -
Hit zoom + 0
This adjusts the window so that the graph fits on your screen. Normally, you would manually adjust the window but that can take 10-15 valuable seconds for even a seasoned graphing calculator user to think about and input. -
Hit 2nd + trace > (calc)
Select "zero" OR press "2" as a shortcut. Then, by holding your arrow buttons, move the "spider" to the left side of the second zero value and press enter. Then move the spider to the right side of the second zero value and press enter. When it prompts you to "guess?", press press enter again. Check out image spoiler (2); the image on the left was taken after I set up the two spiders. The image on the right was taken after I confirmed the calculator's prompt to "guess?" -
Why does this work?
If you didn't know, your calculator can calculate unions (points at which two functions intersect), relative minimums, relative maximums, and zeroes (points where the "y" value of the function equal 0). We are looking for when h, the height of the ball, is 0. We won't use the first point because that's when the ball is first launched.
If you'd like, check out image spoiler (3) for how to do it for real. Use the "zero" function to confirm your answer or replace it if you have no idea how to algebraically solve for it. -
OPTIONAL & HIGHLY RECOMMENDED
Select window and find "Xres." Go ahead and change that to any number between 2 and 8. Xres specifies the rate at which the calculator evaluates the function. (Function evaluations per X display pixels) When Xres = 1, the calculator is evaluating the function for every pixel. Increasing the Xres value can dramatically speed up graph drawing at the cost of some accuracy. (Ex. Using the calculator to find an intersection on points (4,5) between two functions may return (3.999999, 4.999999) when using Xres = 8).
Image Spoiler (1) ["y=" Button]
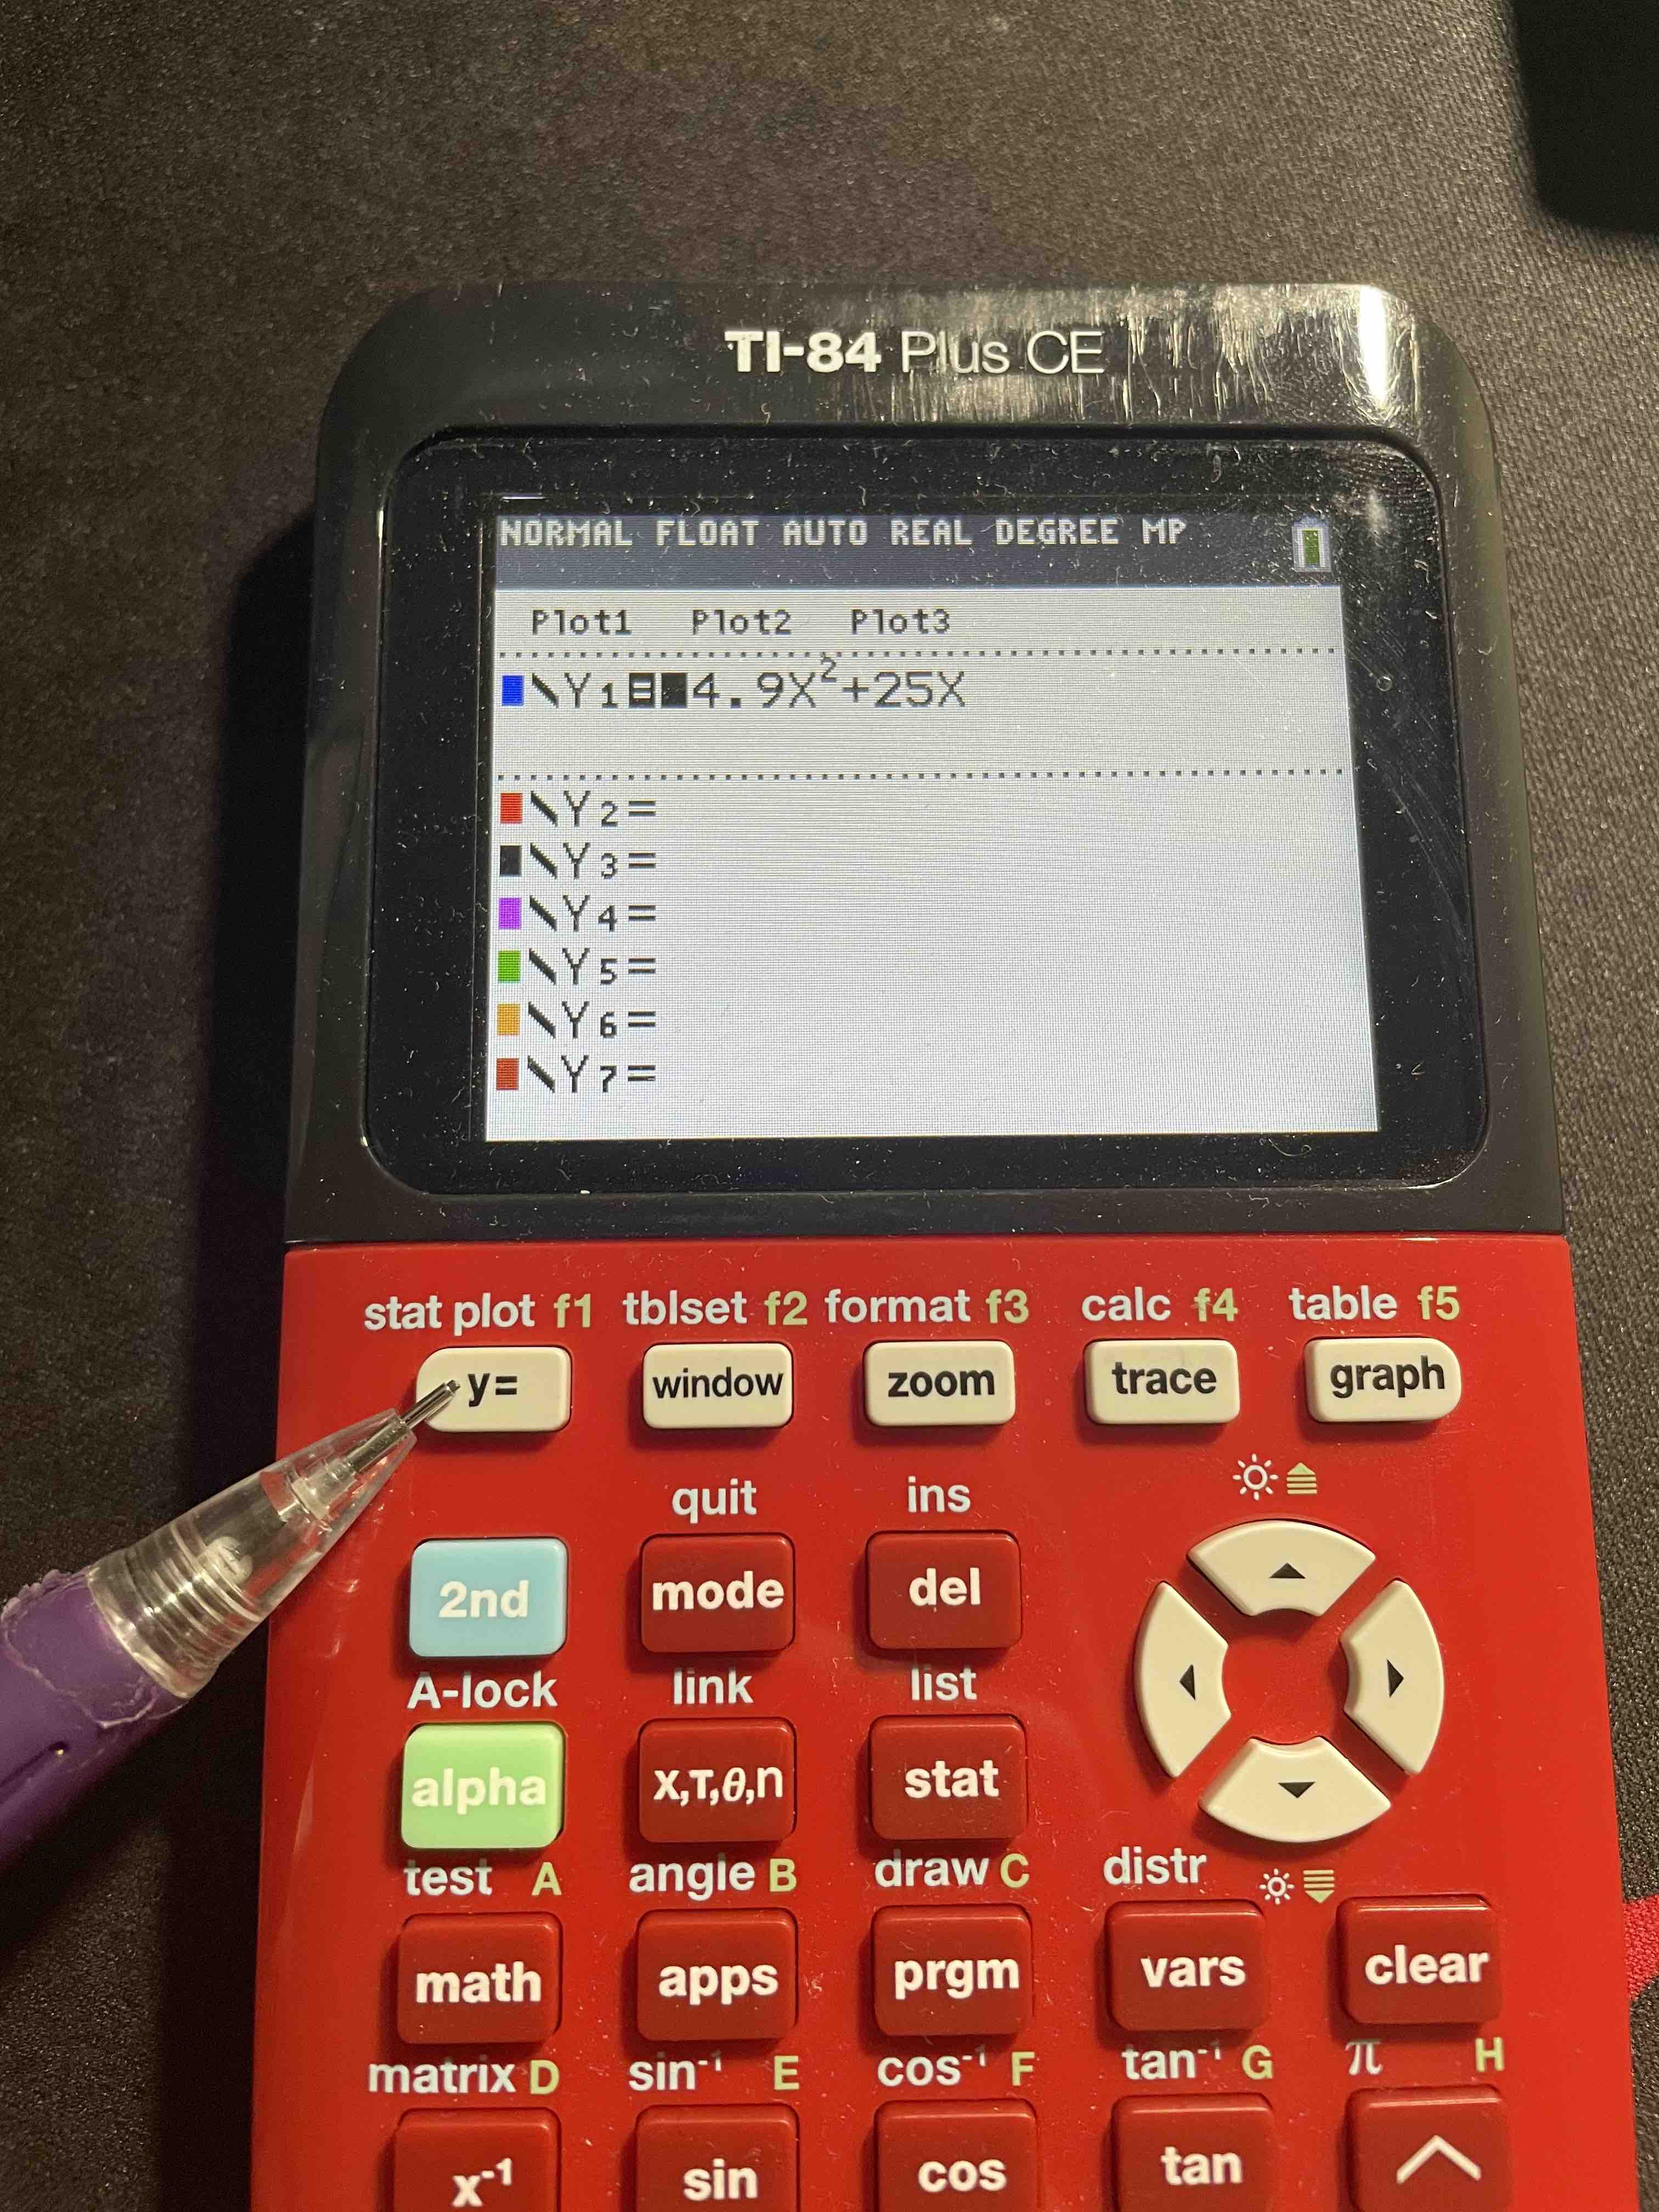
Image Spoiler (2) [Graph Results]
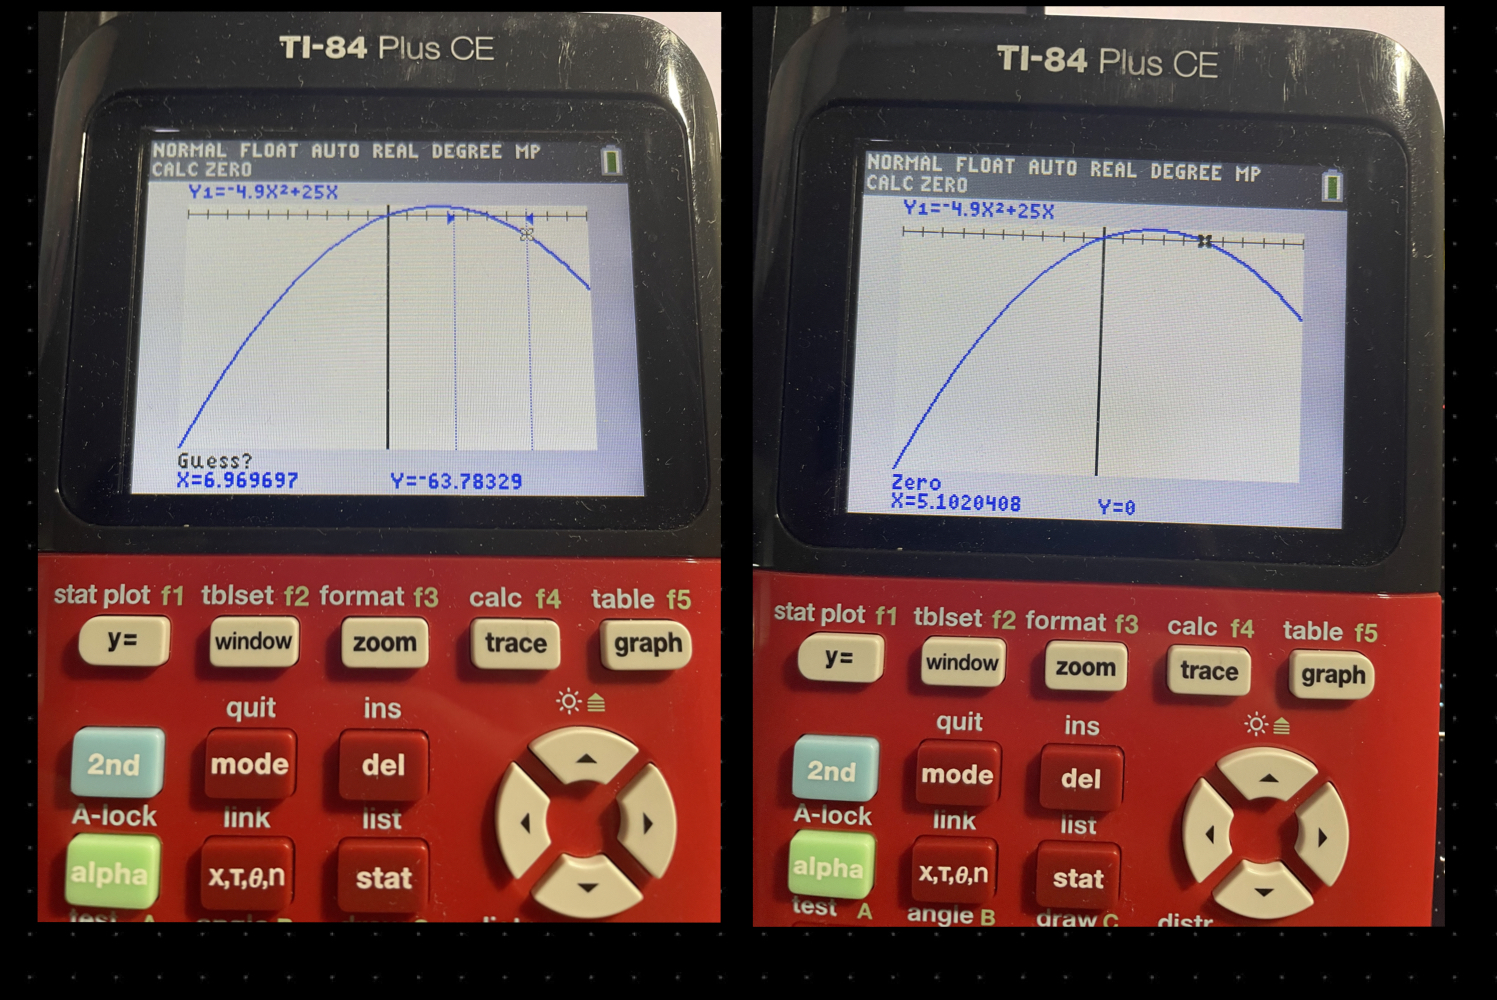
Image Spoiler (3) [How to actually do it]
Lemme try some example problems!
Coming soon
What if I don't have a graphing calculator?
A graphing calculator is a very powerful "last ditch" tool on the SAT.
Graphing calculators are STUPIDLY expensive.
I suggest you check around if you could borrow one from your Math class, schoolmates, or school.
Back
Next